Survey tool
Survey tool
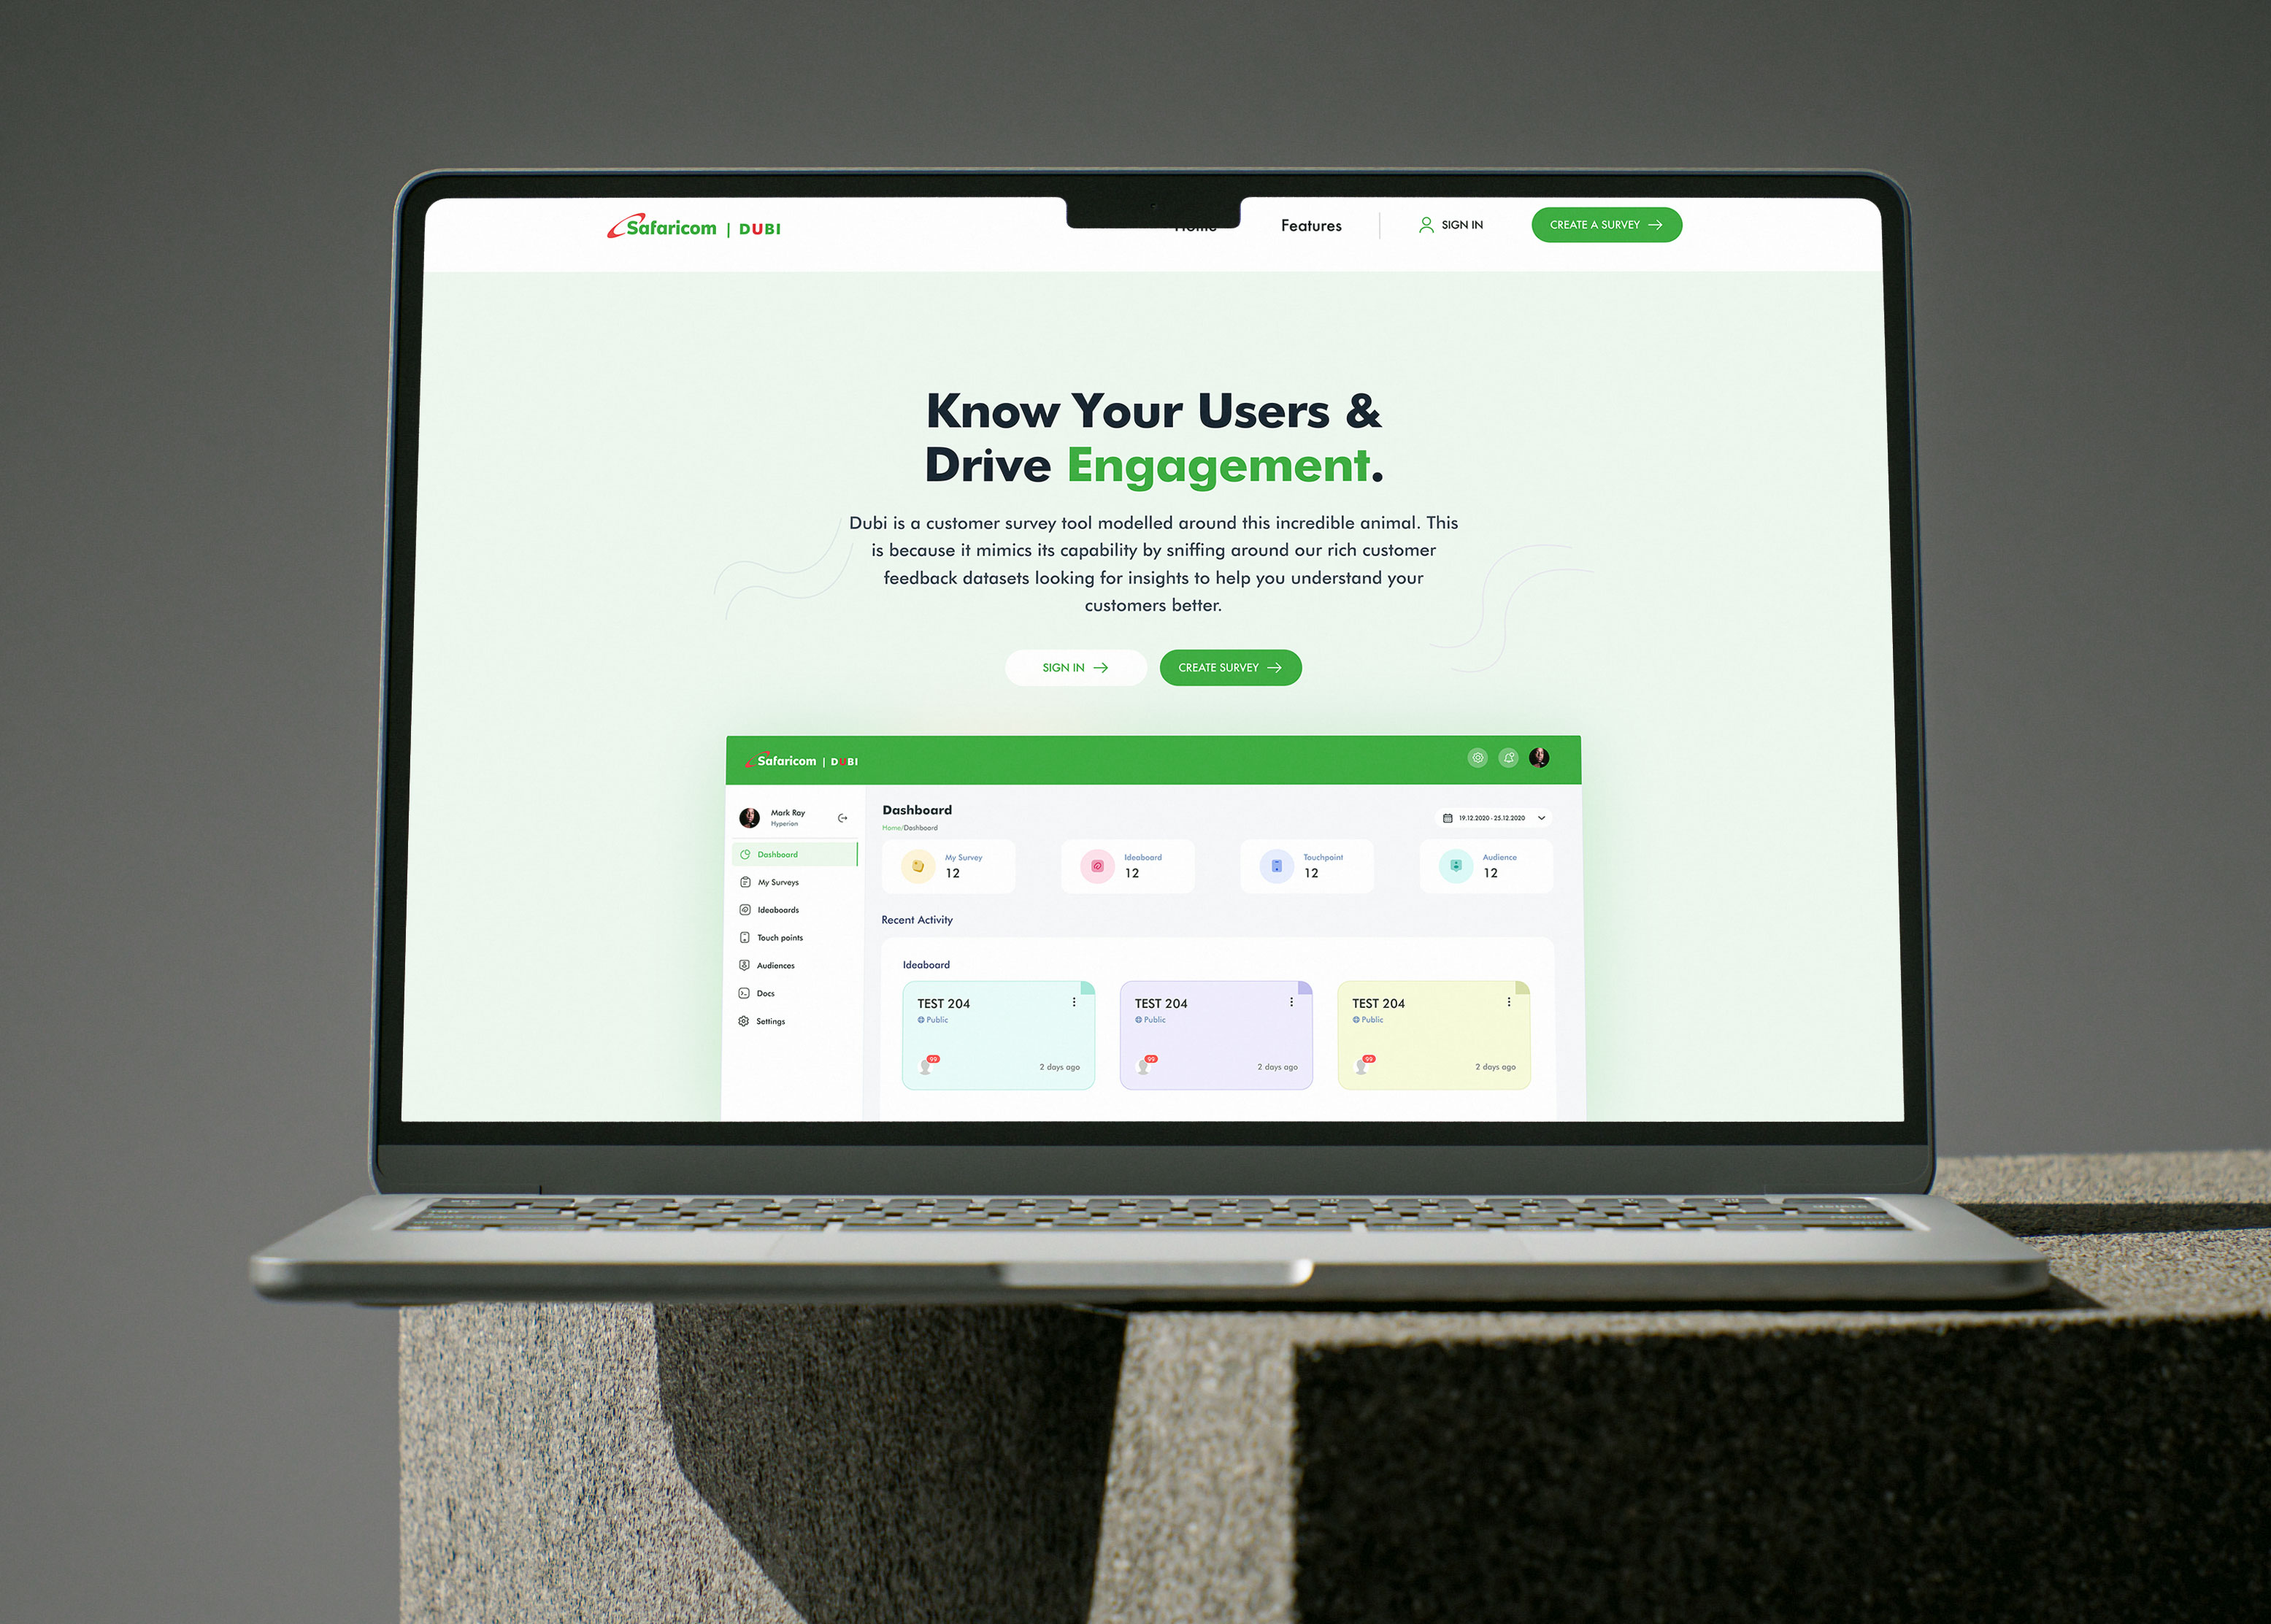
Turning scattered feedback into 4X faster decisions for teams, Powering better products ans expereicnes.
I led the product design process to built Dubi, a unified survey and feedback platform designed to help teams listen, learn, and act at scale.
By connecting automated journey surveys and remove manual audience campaigns creation into one simple experience, Dubi empowers teams to gather insights from over 50M+ users and transform real-time conversations into data-driven decisions.
Key Results
Delivered a unified survey platform for all teams.
Delivered a unified survey platform for all teams.
Reduced manual survey setup time.
Reduced manual survey setup time.
Strengthened feedback visibility for product decisions.
Strengthened feedback visibility for product decisions.
Role &Timeline
Product Designer
July 2024
Methods
User Research / User Journey Mapping / Competitive Analysis / Visual design / Prototyping / Testing
What's the big deal?
After launch in Kenya and Ethiopia, the project bagged 1st position during the SAFARICOM 2024 GROUP CEO AWARD Under the Best Innovation (Customer Obsession Pilar)
Awards
SAFARICOM
2024 GROUP CEO AWARD
Best innovation (customer obsession Pillar)

Awards
SAFARICOM
2024 GROUP CEO AWARD
Best innovation (customer obsession Pillar)
👇 A glimpse of Dubi

How we got there
How we got there
The Problem
As Safaricom expanded its digital ecosystem, understanding user sentiment across multiple products became a growing challenge. Feedback lived in silos — scattered across surveys, journeys, and manual lists — making it difficult for teams to act quickly or consistently.
Gaps we couldn't Ignore


Scattered Feedback Channels
User insights were spread across multiple tools — Google Forms, Typeform, and ad-hoc spreadsheets. This fragmentation made it difficult to consolidate feedback or identify trends across journeys.
Manual and Time-Consuming Processes
Teams relied on manual uploads and custom reports to gather survey responses, which slowed down decision-making and introduced human error.
Lack of Real-Time Insights
Surveys weren’t connected to customer journeys, meaning insights came too late to influence live experiences. Teams needed a way to trigger and analyze feedback in real-time.
The Design Process
They say your design process is important, but they don’t tell you that every problem and situation will demand something new and different. So, no it was not double diamond, lean or agile, we were the process.
Improvise
Improvise
The clock was ticking, so our best bet was to get started first, then build on top iterating on the fly.
It is a long established fact that a reader will be distracted by the readable
Improvise
Improvise
The clock was ticking, so our best bet was to get started first, then build on top iterating on the fly.
The clock was ticking, so our best bet was to get started first, then build on top iterating on the fly.
Adapt
Adapt
Things were unpredictable, insights kept us going, helping us to adapt through different problems
Things were unpredictable, insights kept us going, helping us to adapt through different problems
This led to; defining the problem in two folds:
User’s Lens:
User’s Lens:
How might we make feedback more personal and connected to real product experiences — so users feel genuinely heard rather than fatigued by repetitive, disjointed surveys?
How might we make feedback more personal and connected to real product experiences — so users feel genuinely heard rather than fatigued by repetitive, disjointed surveys?
User’s Lens:
User’s Lens:
How might we make feedback more personal and connected to real product experiences — so users feel genuinely heard rather than fatigued by repetitive, disjointed surveys?
How might we make feedback more personal and connected to real product experiences — so users feel genuinely heard rather than fatigued by repetitive, disjointed surveys?
Who needs Help?
During discovery, our goal was to understand what teams across Safaricom needed from a survey and feedback system. Through stakeholder workshops and interviews, we identified key user requirements that guided Dubi’s design direction:
Reguirements and Persona
Product Managers, Researchers & Marketing Teams
Requirement
A unified, easy-to-use platform to launch, track, and analyze targeted surveys
Insight
Teams needed a single source of truth for feedback collection, segmentation, and measuring feature or campaign success without relying on multiple external tools.
Developers, Executives & Analysts
Requirement
Seamless integration and real-time analytics dashboards
Insight
An effortless survey triggers within journeys and instant access to engagement, NPS, and performance data to make faster, data-driven decisions.
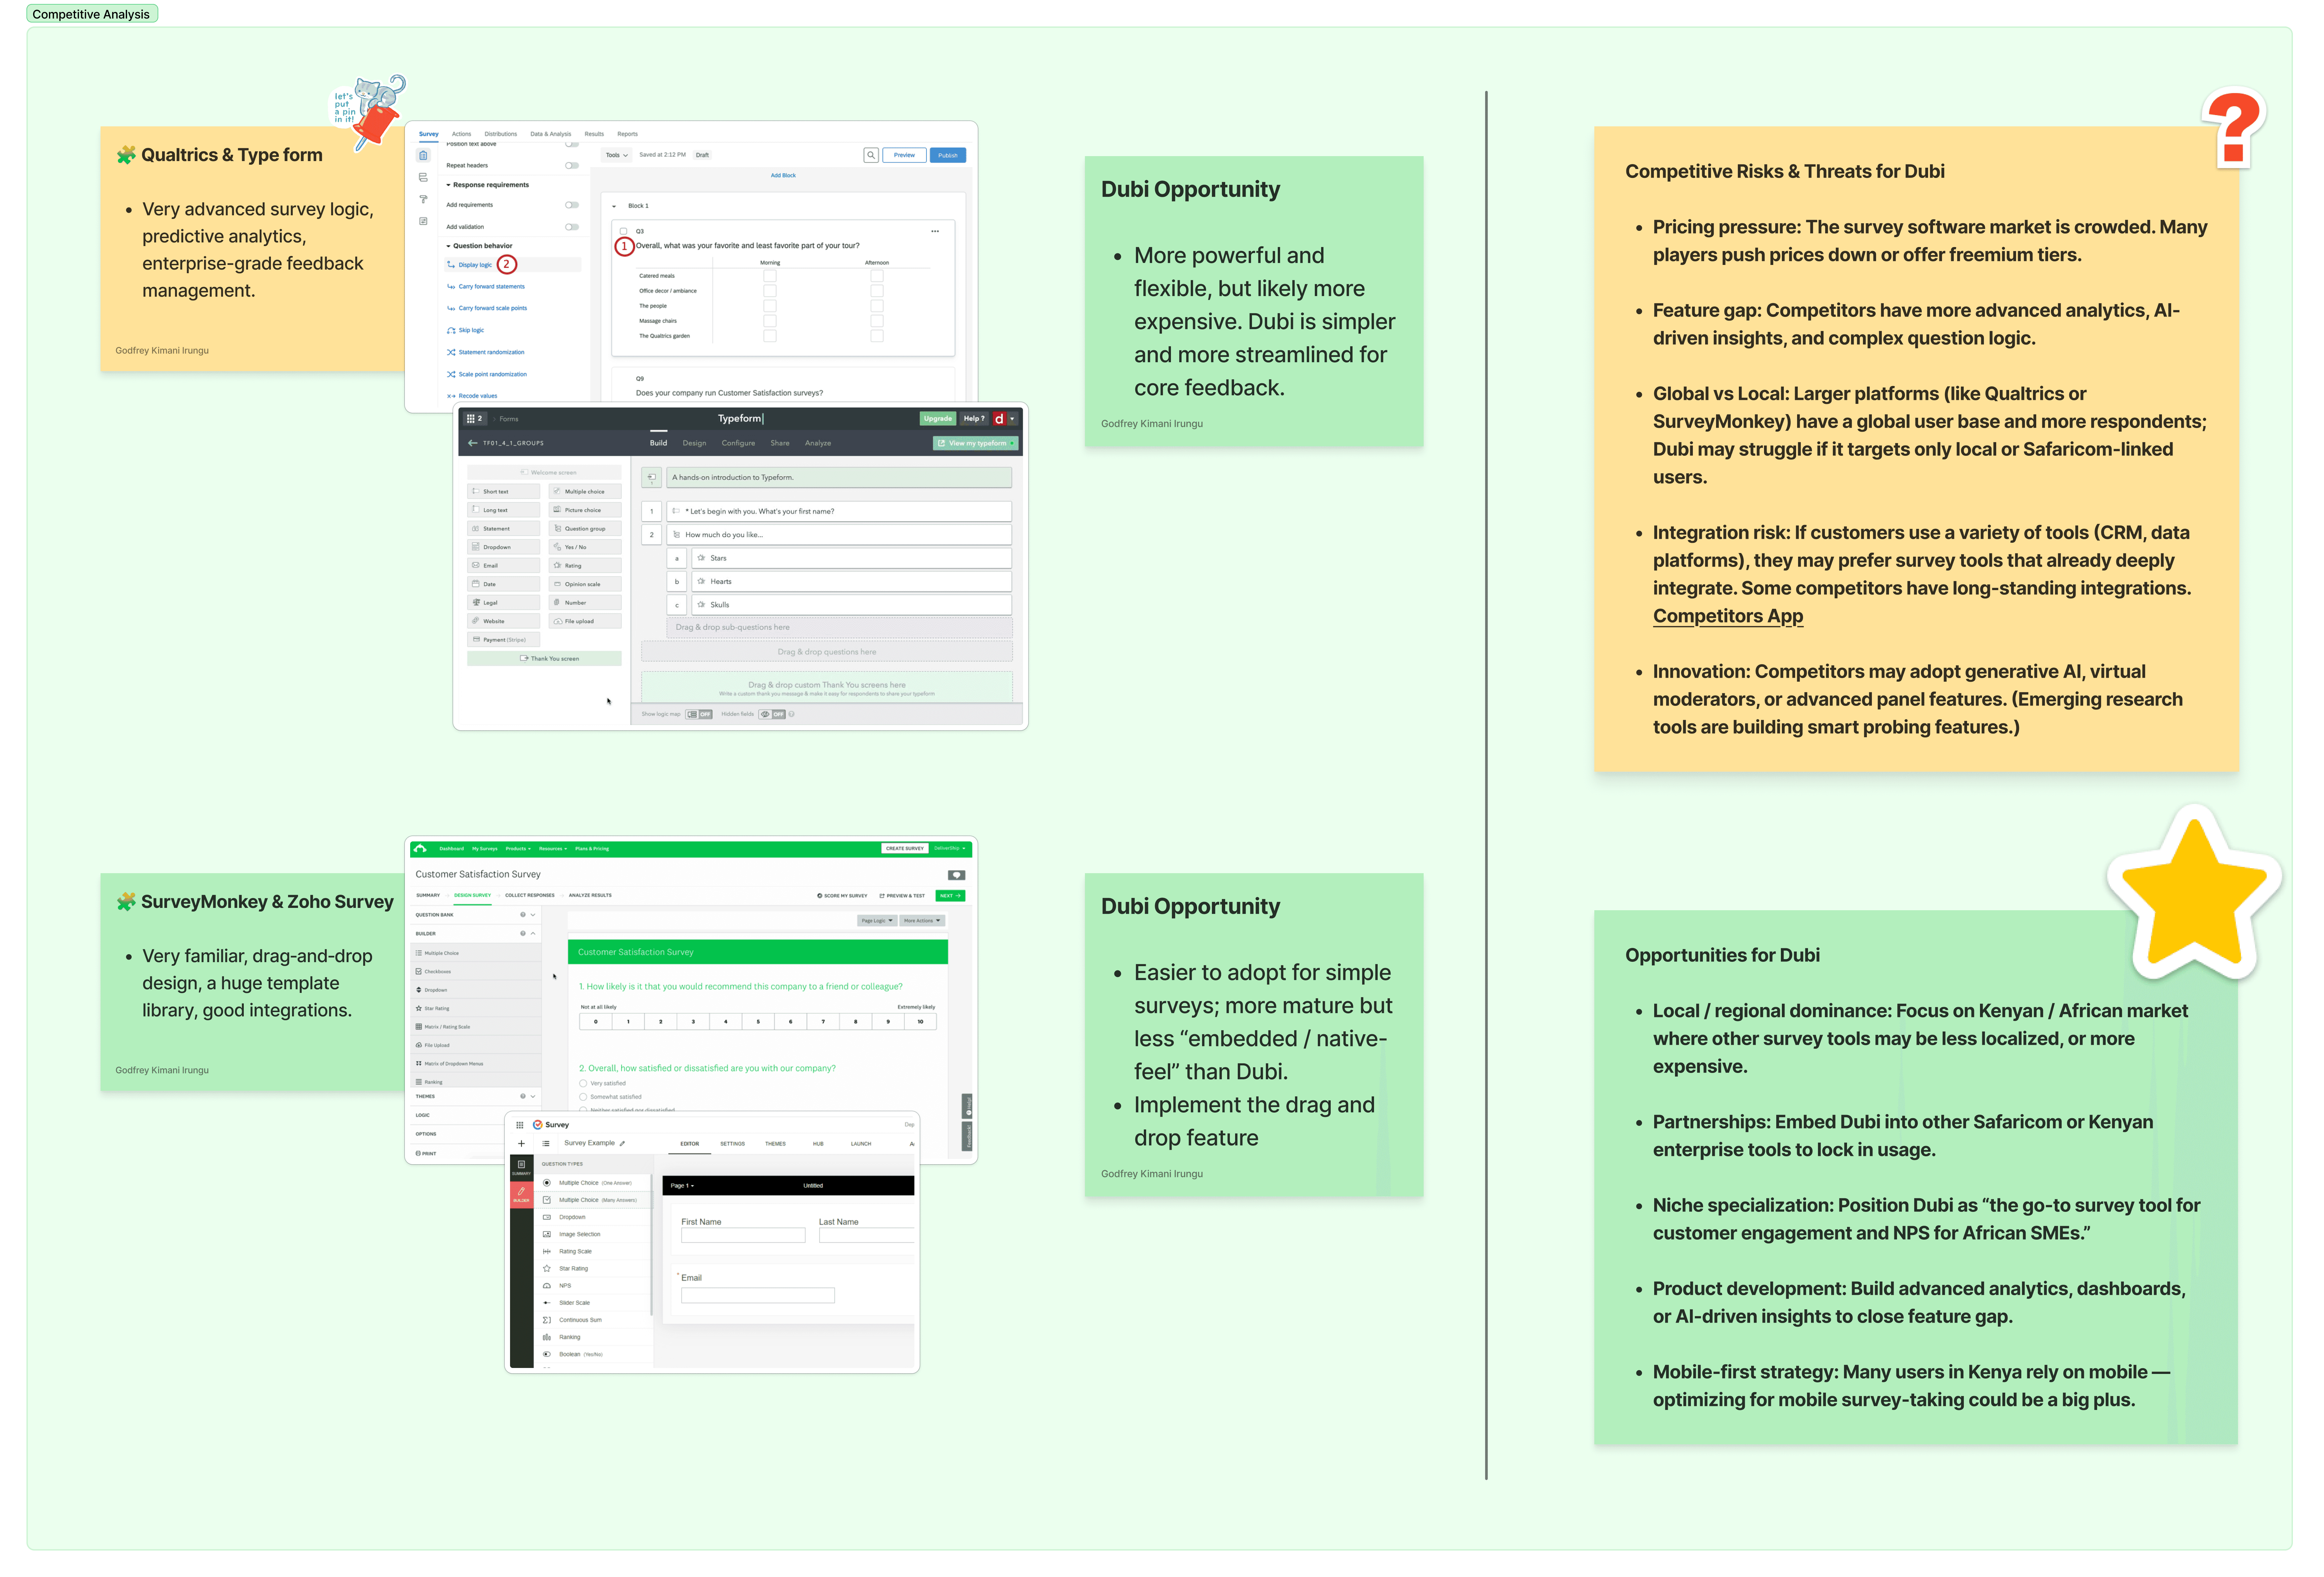
Competitive analysis
I conducted a competitive analysis to identify commonalities among competitors and gather valuable insights for building our product. This allowed me to differentiate ourselves and provided a basis for product development.
User flows
I created a visual user flow to align with the feature functionality before designing the interface. This also contributes to a smoother navigation experience, helping users accomplish tasks efficiently.

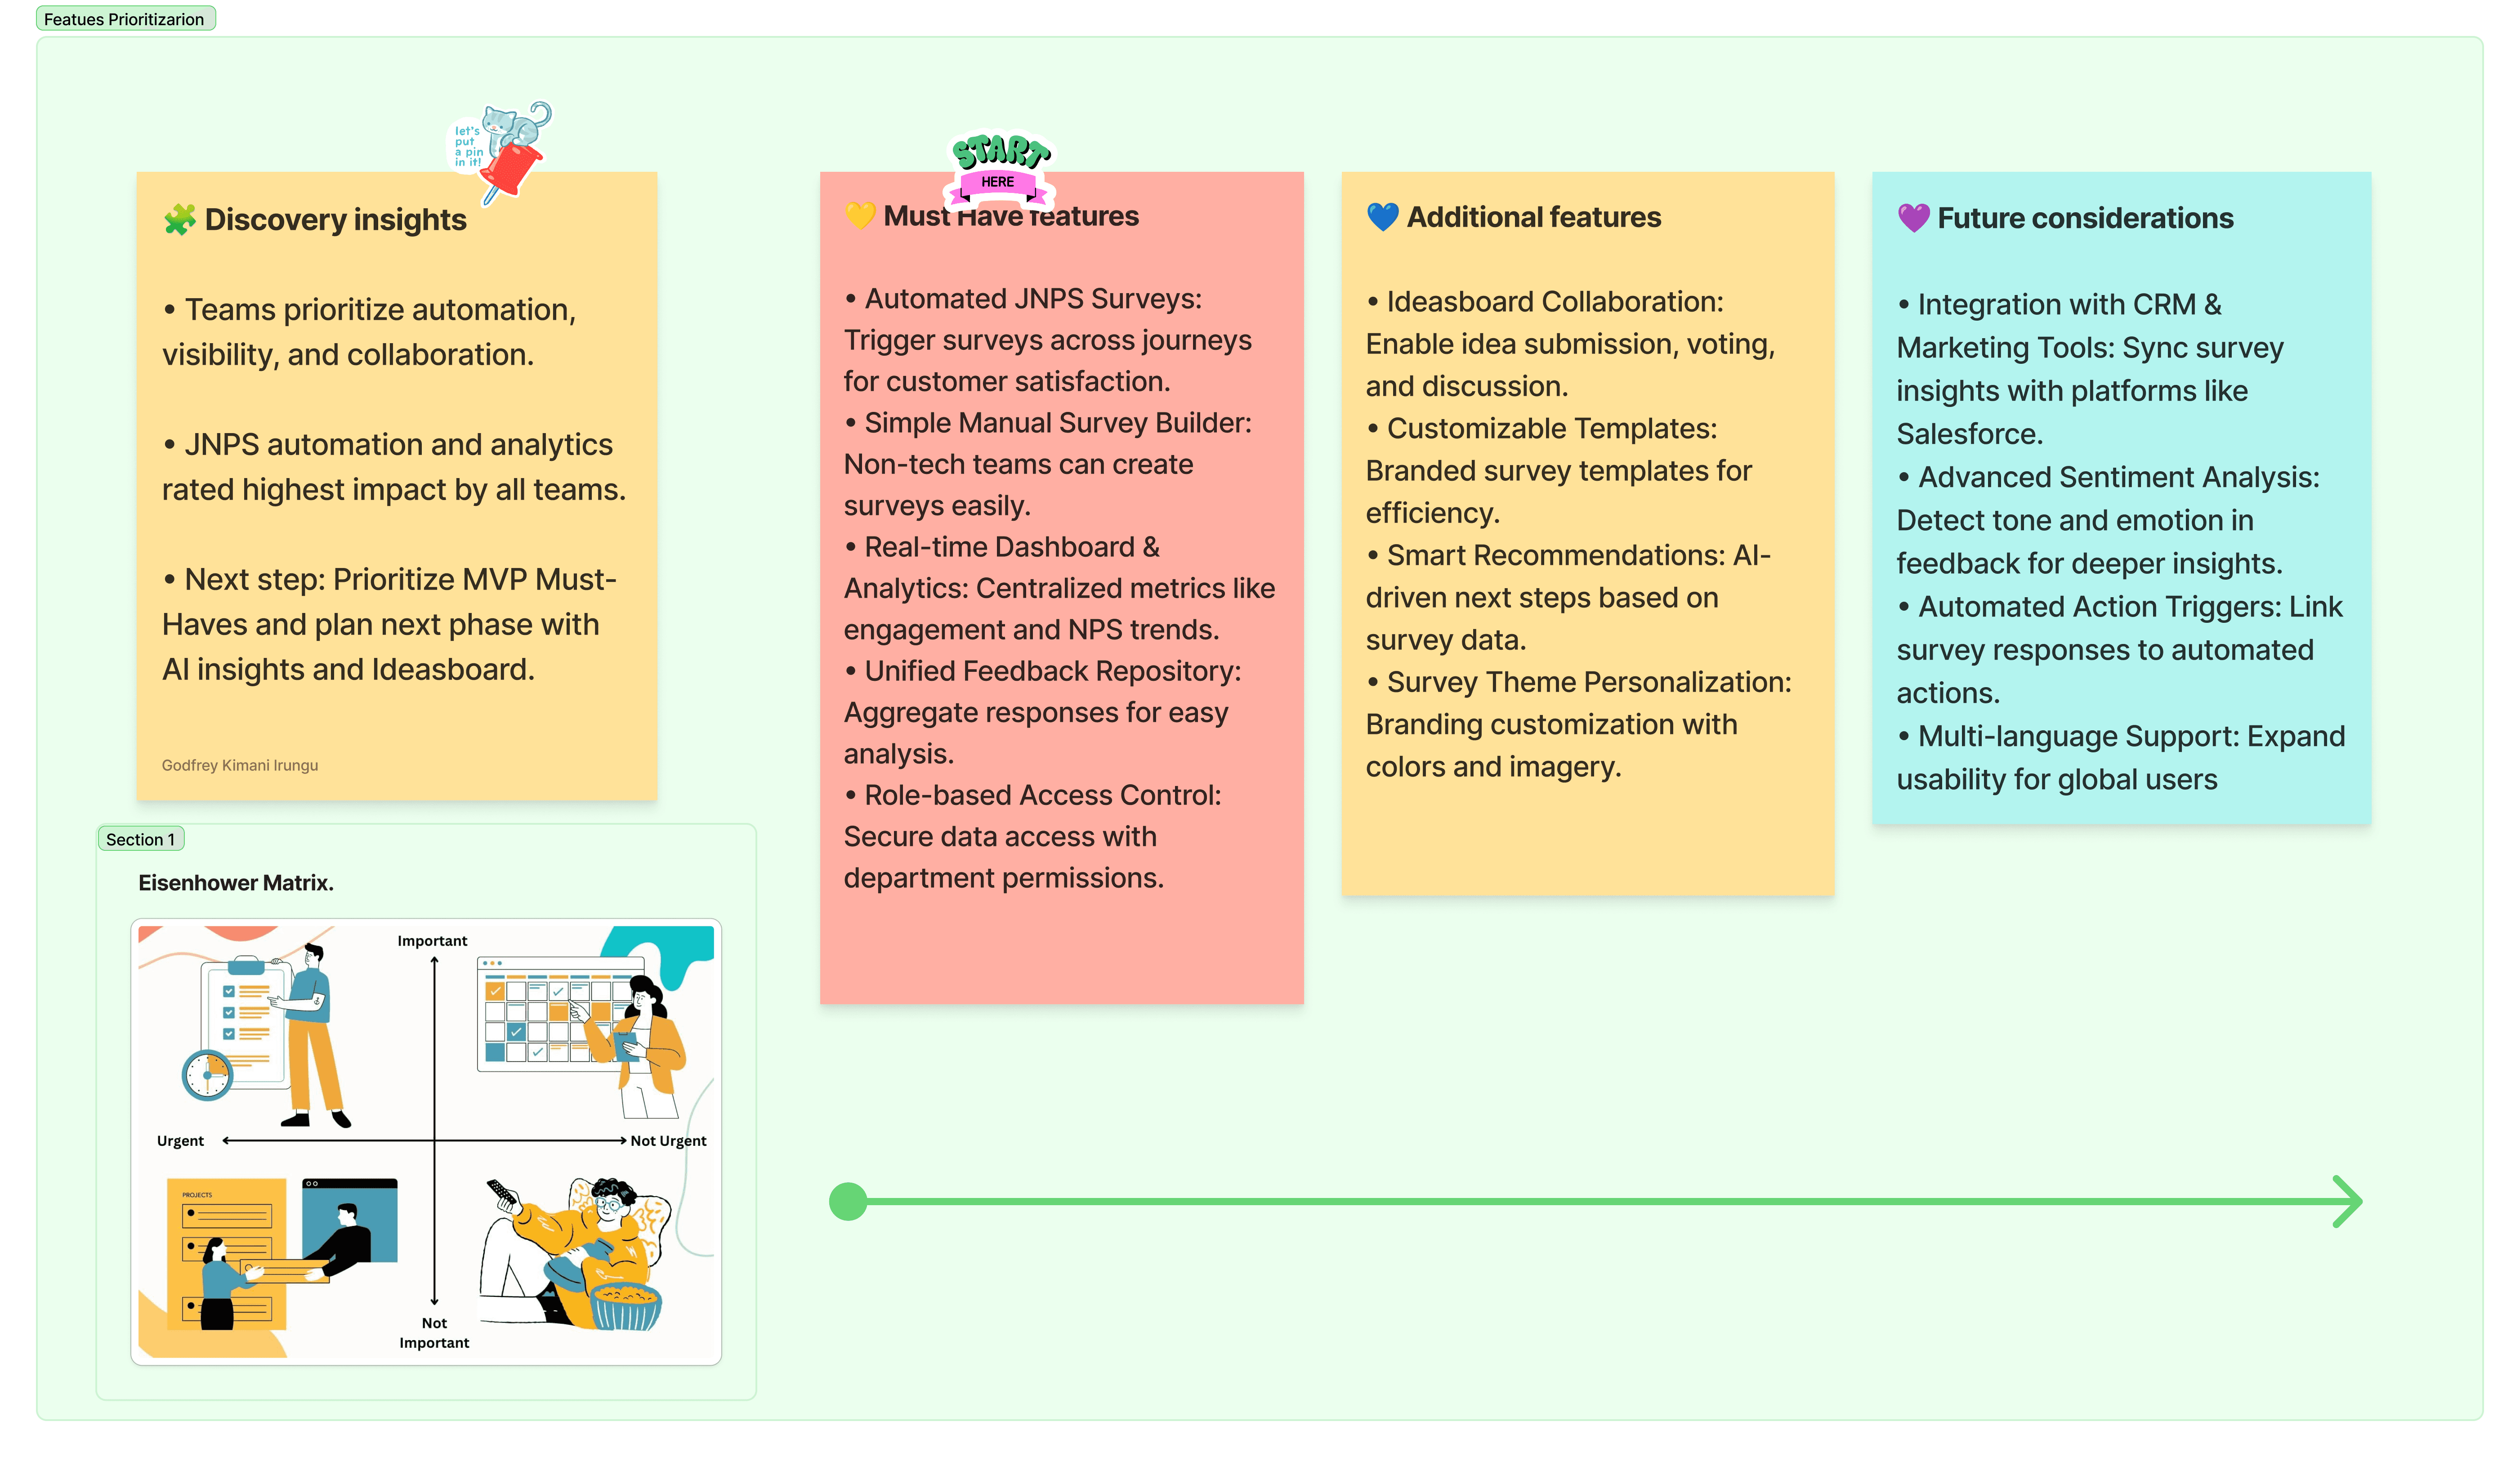
Feature Prioritization
We sorted out ideas through an Eisenhower Matrix. (also called the Urgent-Important Matrix) is a prioritization framework that helps teams and individuals decide what to focus on first — based on urgency and importance.
Let's get to work
Let's get to work
The MVP
With all the necessary foundations, knowledge, and preparation in place, I began to design the interface for dubi. We prioritized the creation of surveys through templates with ready questions since it was faster to implement. The design aimed to add make the whole process of creating, sharing and gathering responses a simple and straight forward without compromising efficiency and prioritize user-centricity.
Landing Page
A centralized hub for managing all ideaboards. Including a quick board creation and user engaugement.
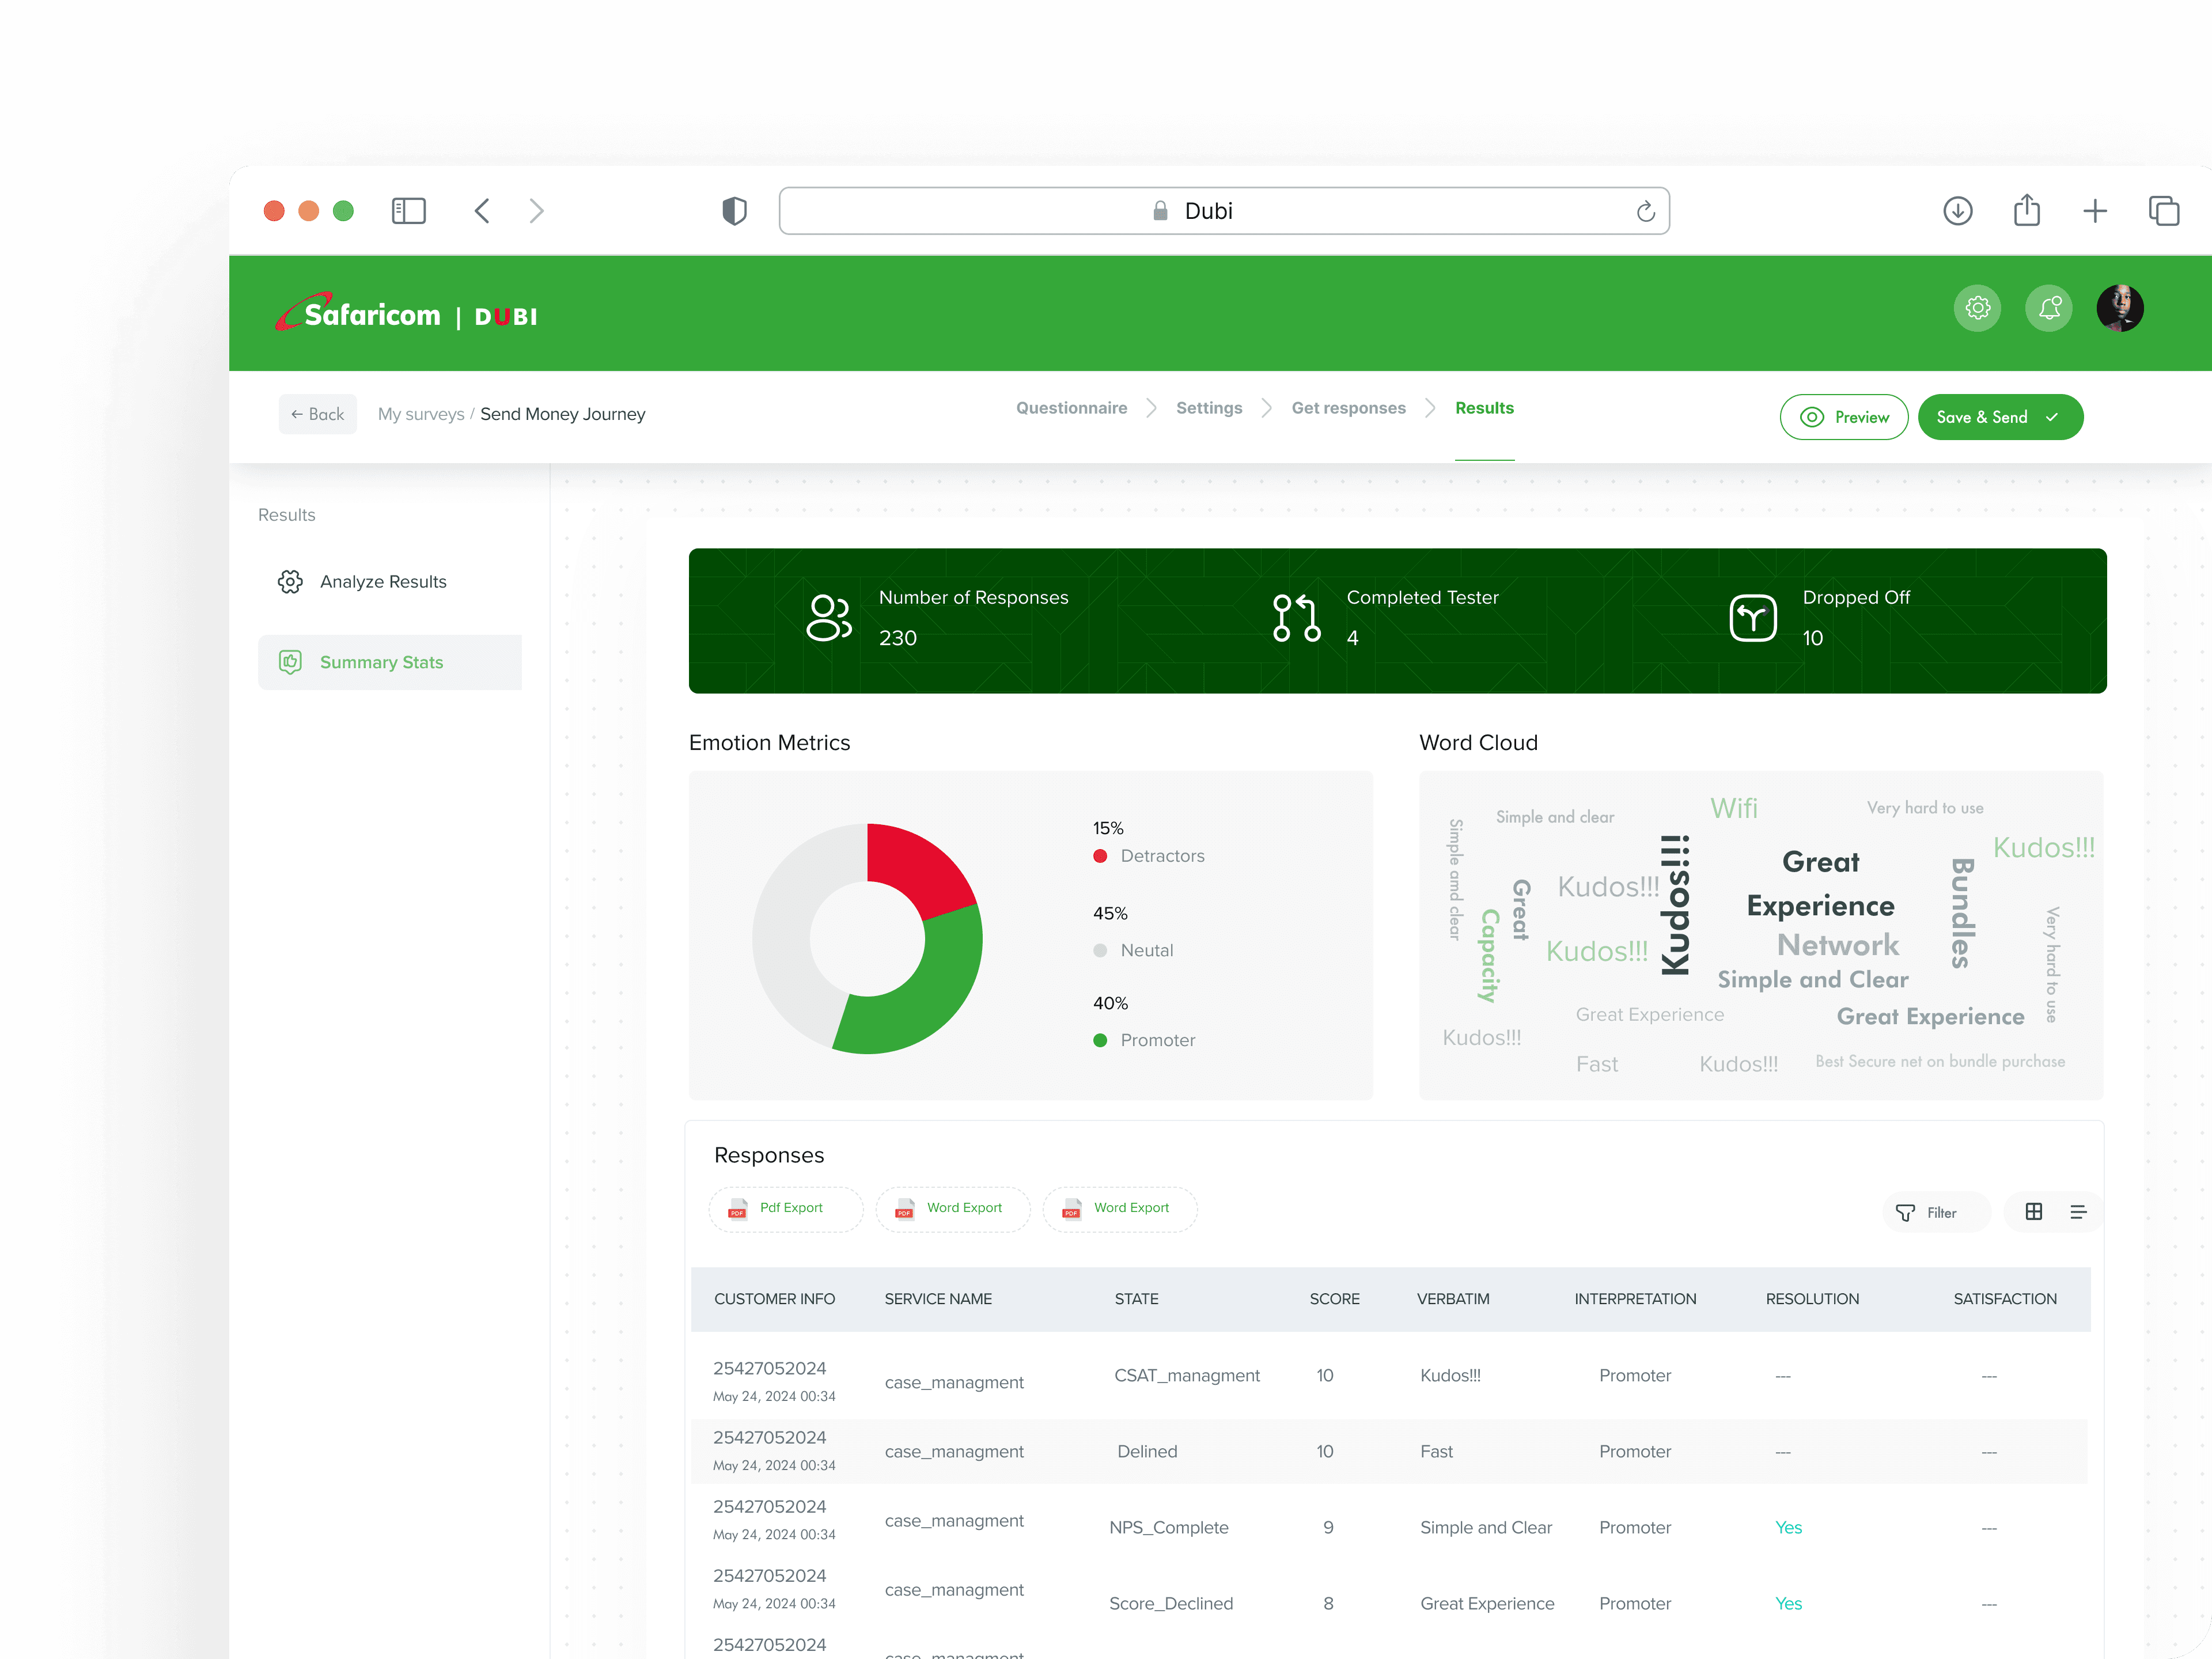
A summary dashboard where users can view summaries, track responses and detailed analytics.
A user-friendly interface with drag-and-drop functionality and pre-build questions.
Pre-made templates with pre-set questions that match each type of survey.

Blank Template
Create questions from scratch
Add and setup contents easily

Customer Satisfaction Score
Gauge customer happiness
Get overall satisfaction of a product

Feedback Form
Measure the loyalty of customers
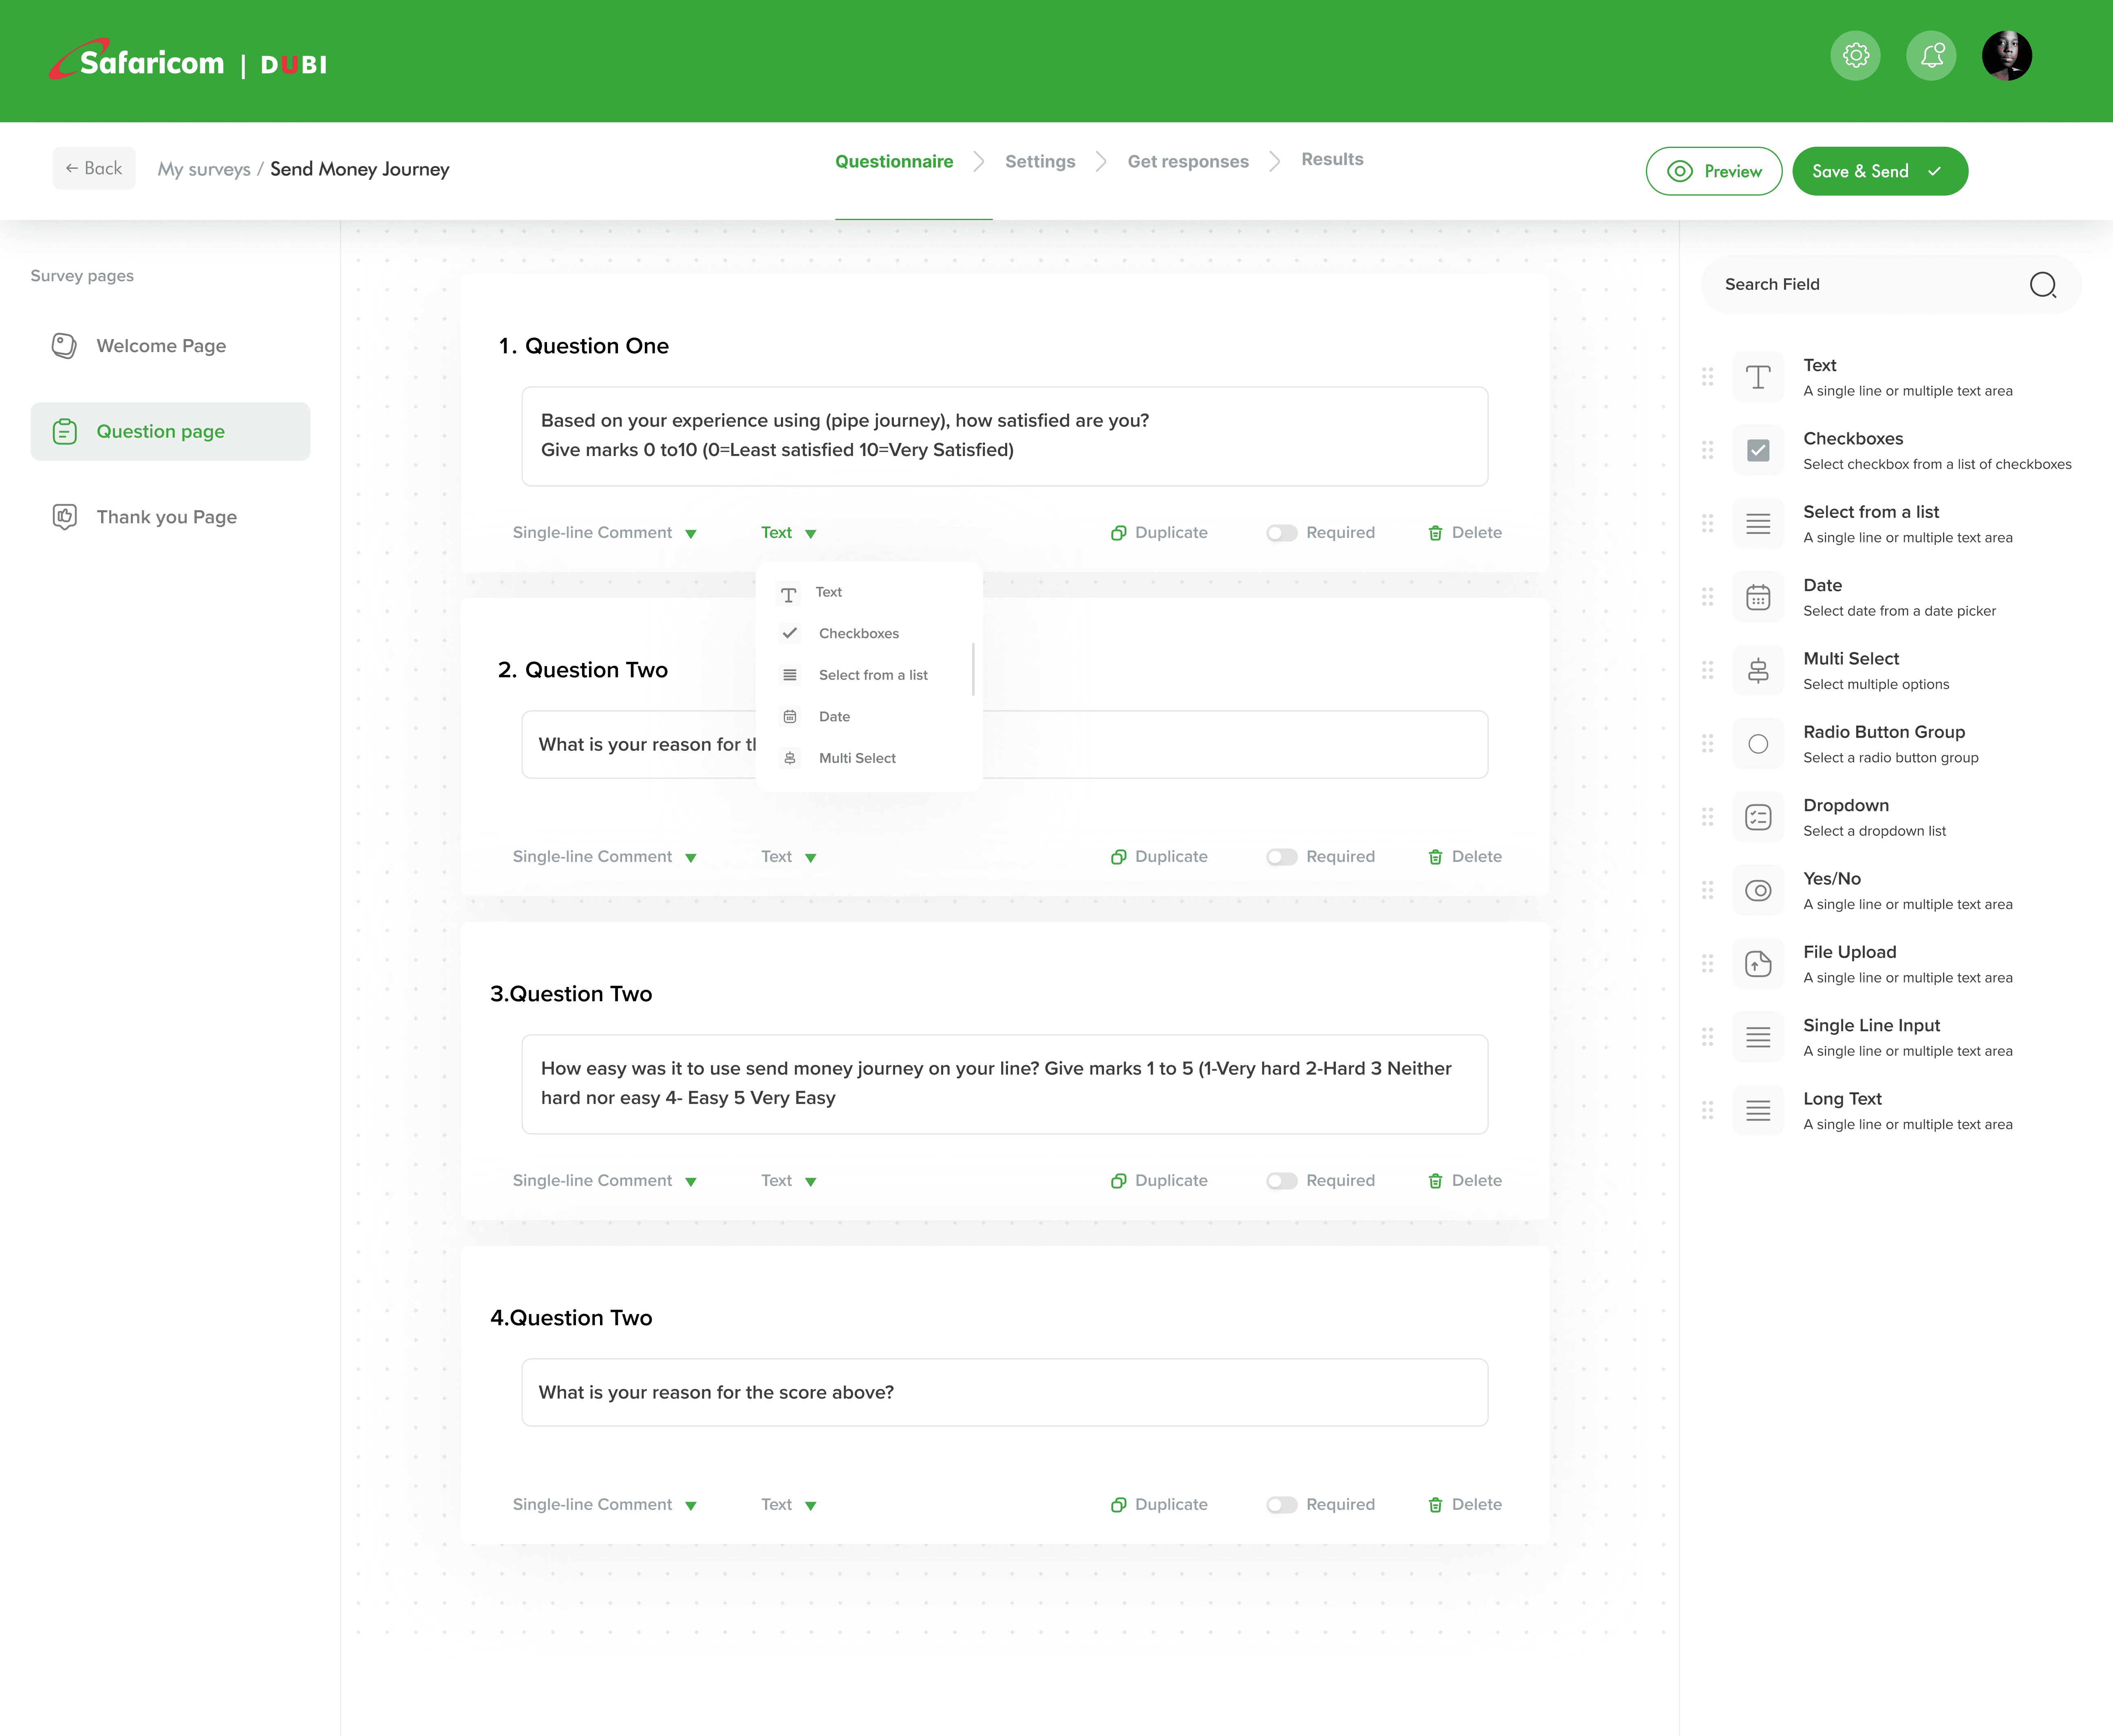
Survey Creation
A simple and straight forward way users can build effective surveys and get valuable insights.
A tool for designing surveys with various question types.
A tool for designing surveys with various question types.
Survey Distribution: Option to share survey via email and as a short code.
Survey Distribution: Option to share survey via email and as a short code.
Data analysis: A tool to analyse and visualise survey data
Data analysis: A tool to analyse and visualise survey data
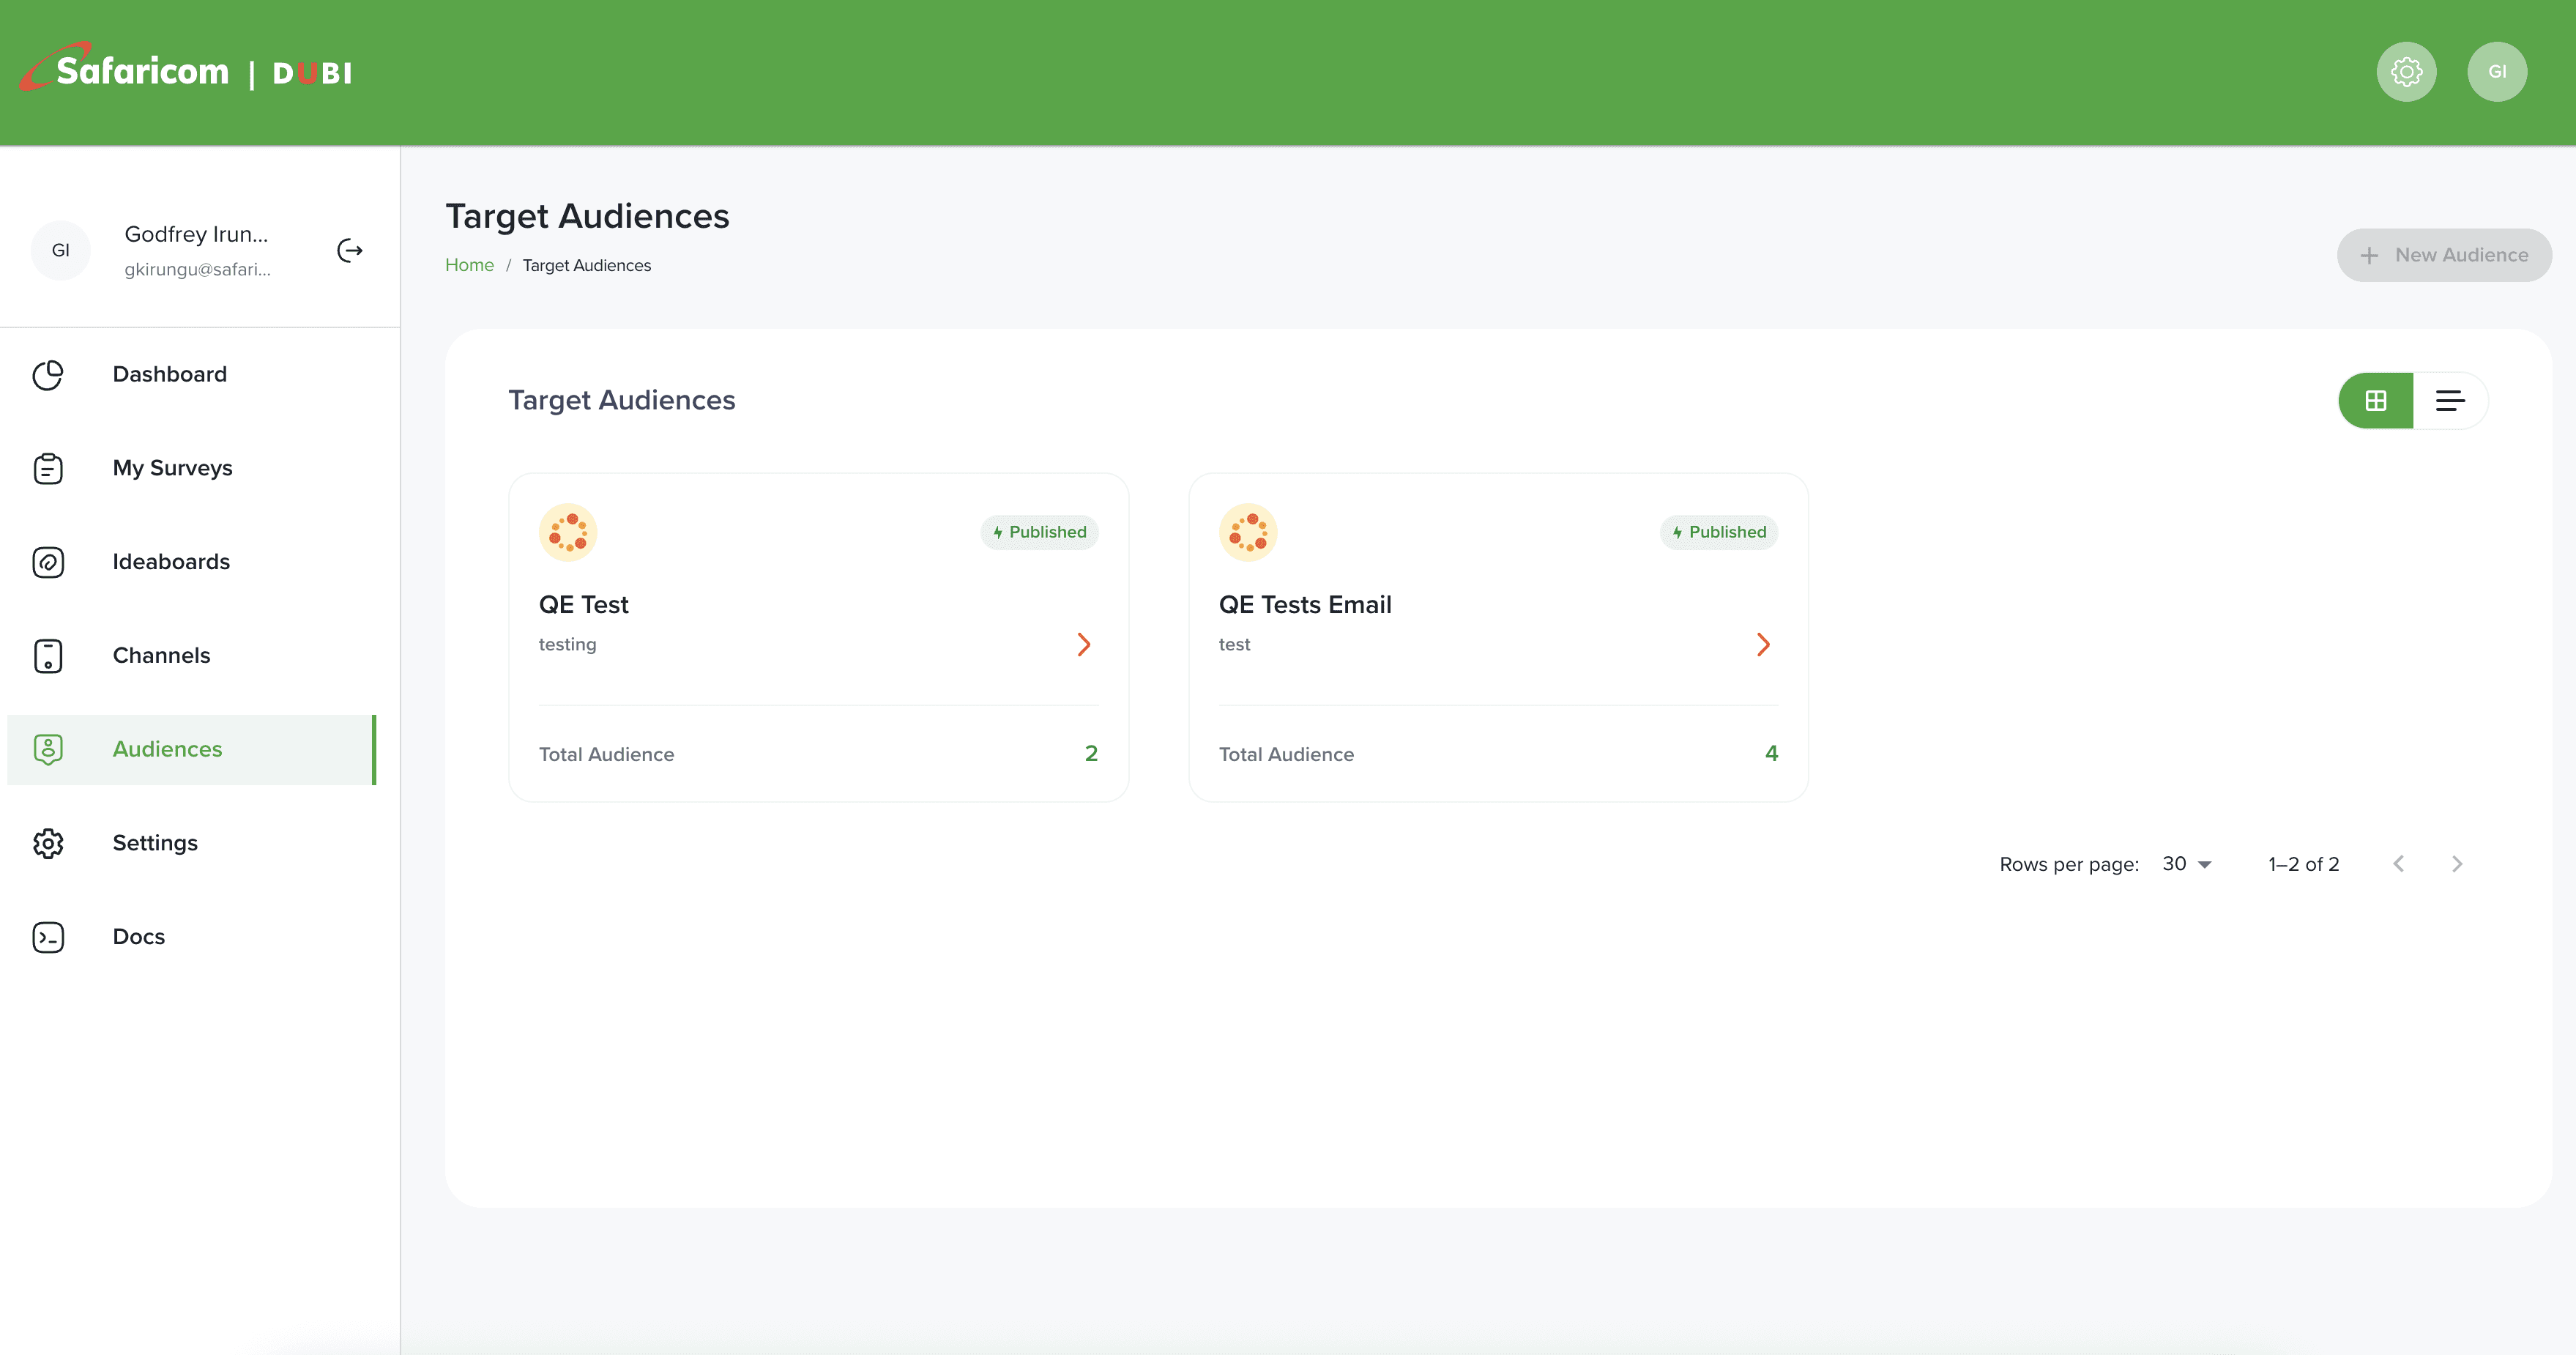
Audience Creation
Touch Point (channel)
A touch point (channel) is any interaction or point of contact between a user and a product, service, or brand. We created an idea board to map out all potential touch points, such as website visits, mobile app notifications, customer support calls, social media interactions, and in-store experiences.
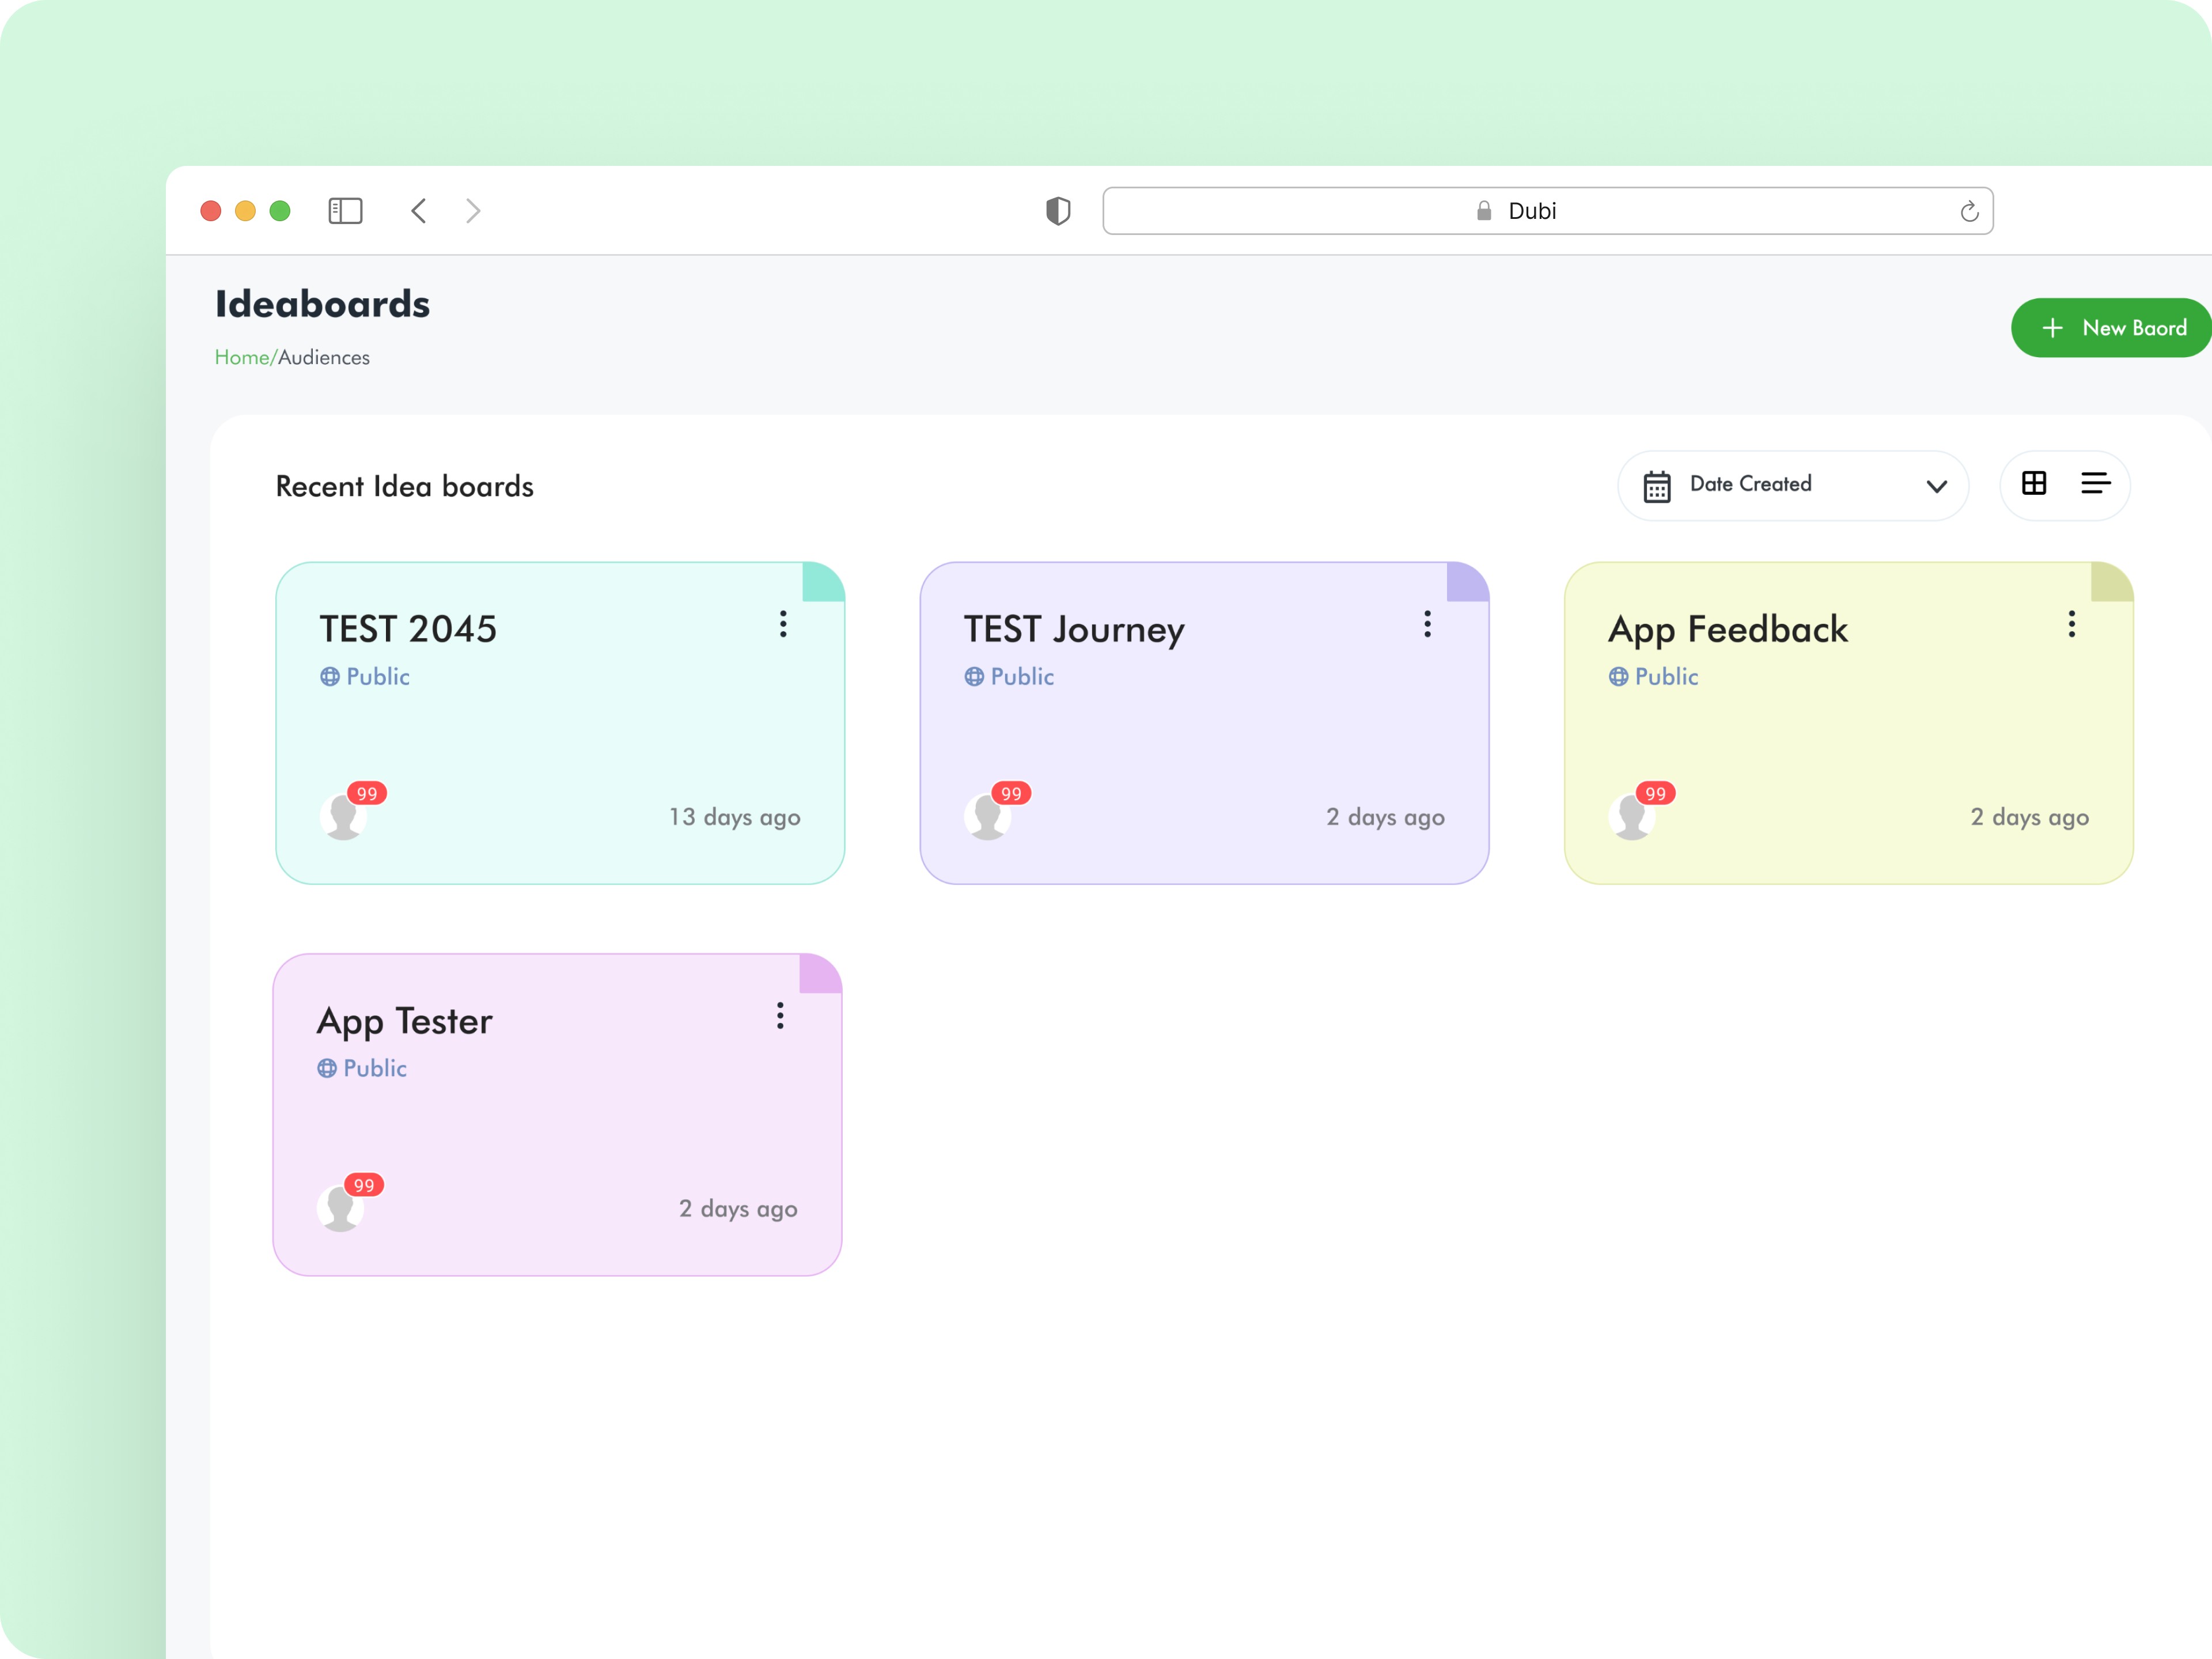
Idea Board
A simple Internal Ideaboard for collecting and organize internal thoughts track problems, insights, or options during a project or team retros.
Analytic Dashboard
A center hub for managing all surveys, including a quick survey creations, Idea board and performance metrics
Business Value
Business Value
Impact (First 3 Months)
After the General Availability launch of 2FA, we utilized Microsoft Clarity and Metabase data to track and address any usability issues, ensuring the achievement of our business goal.
Total Surveys Created
604
Journey NPS
97
Simple Surveys
507
Total Surveys Created
604
Journey NPS
97
Simple Surveys
507
JNPS Survey Engagements:
92+ million
High-volume engagement from automated journey surveys (JNPS).
JNPS Survey Engagements:
92+ million
High-volume engagement from automated journey surveys (JNPS).
Audience Engagement
4.8 million
Represents the total number of user responses/conversations from manual/audience surveys.
Audience Engagement
4.8 million
Represents the total number of user responses/conversations from manual/audience surveys.
Total Audiences Uploaded
51+ million
Indicates the wide reach and potential exposure of Dubi surveys.
Total Audiences Uploaded
51+ million
Indicates the wide reach and potential exposure of Dubi surveys.
Testimonials
Testimonials
Users Reviews
"Automated surveys saved our teams hours, produced reliable signals, and helped us track shifts across journeys with ease"
Segment Lead
Safaricom, Ethiopia
10 Sep, 2024
"Audience uploads feel smooth even with huge lists. Pre and post campaign surveys help me catch drop-offs early, but I need stronger segmentation."
Segment Lead
Safaricom, Kenya
13 Nov, 2024
Next Steps
Looking ahead, we also continued to think about ways to improve the user experience, such as 🤖Adding AI-powered insights agent, ideas board enhancements, and cross-team governance templates to sustain and scale user engagement.
🧭Feedback Triage System -A centralized dashboard will help teams triage incoming feedback, assign ownership, track resolution status, and ensure that valuable customer input is acted on efficiently.
📈Elegant Multi-Metric Display - Enhanced NPS and CSAT trend charts with gradient fills and smooth animations Vibrant Emotional Ratings - Interactive pie chart with delighted, neutral, and frustrated sentiment indicators.
💬Emotional Rating Visualization - An interactive sentiment pie chart will showcase delighted, neutral, and frustrated responses, giving a quick, emotional snapshot of the customer experience at a glance.
Lessons Learned
After the launch, I realized several key lessons. Reflecting on the process from planning to execution revealed insights about the importance of adaptability and open-mindedness. These reflections deepened my understanding and offered valuable lessons for future launches and products.
I learned that simplicity and automation drive adoption.
A cross-functional effort between UX, engineering, and marketing teams. Led the product design vision from discovery to rollout — driving clarity, speed, and measurable impact.A cross-functional effort between UX, engineering, and marketing teams. Led the product design vision from discovery to rollout — driving clarity, speed, and measurable impact.
The team behind
The team behind
Meet our team
Clinton Wekesa
Action Product Owner
Clinton Wekesa
Action Product Owner
Stephen Maina
Tech Lead Software Engineering
Stephen Maina
Tech Lead Software Engineering
Christopher Muiruri
Frontend Web Developer
Christopher Muiruri
Frontend Web Developer
Francis Gituku
Research and Planning.
Francis Gituku
Research and Planning.
Alex Karanja
Ux Lead
Alex Karanja
Ux Lead
Moses Mutua
Bunisness Analyst
Moses Mutua
Bunisness Analyst
Gloria Mutie
Backend Developer
Gloria Mutie
Backend Developer
Nehemiah Cheburet
Solution Architect
Nehemiah Cheburet
Solution Architect
Survey tool
Turning scattered feedback into 4X faster decisions for teams, Powering better products ans expereicnes.
I led the product design process to built Dubi, a unified survey and feedback platform designed to help teams listen, learn, and act at scale.
By connecting automated journey surveys and remove manual audience campaigns creation into one simple experience, Dubi empowers teams to gather insights from over 50M+ users and transform real-time conversations into data-driven decisions.
Key Results
Delivered a unified survey platform for all teams.
Reduced manual survey setup time.
Strengthened feedback visibility for product decisions.
Role &Timeline
Product Designer
July 2024
Methods
User Research / User Journey Mapping / Competitive Analysis / Visual design / Prototyping / Testing
What's the big deal?
After launch in Kenya and Ethiopia, the project bagged 1st position during the SAFARICOM 2024 GROUP CEO AWARD Under the Best Innovation (Customer Obsession Pilar)
Awards
SAFARICOM
2024 GROUP CEO AWARD
Best innovation (customer obsession Pillar)
👇 A glimpse of Dubi
How we got there
The Problem
As Safaricom expanded its digital ecosystem, understanding user sentiment across multiple products became a growing challenge. Feedback lived in silos — scattered across surveys, journeys, and manual lists — making it difficult for teams to act quickly or consistently.
Gaps we couldn't Ignore
Scattered Feedback Channels
User insights were spread across multiple tools — Google Forms, Typeform, and ad-hoc spreadsheets. This fragmentation made it difficult to consolidate feedback or identify trends across journeys.
Manual and Time-Consuming Processes
Teams relied on manual uploads and custom reports to gather survey responses, which slowed down decision-making and introduced human error.
Lack of Real-Time Insights
Surveys weren’t connected to customer journeys, meaning insights came too late to influence live experiences. Teams needed a way to trigger and analyze feedback in real-time.
The Design Process
They say your design process is important, but they don’t tell you that every problem and situation will demand something new and different. So, no it was not double diamond, lean or agile, we were the process.
Improvise
The clock was ticking, so our best bet was to get started first, then build on top iterating on the fly.
Improvise
The clock was ticking, so our best bet was to get started first, then build on top iterating on the fly.
Adapt
Things were unpredictable, insights kept us going, helping us to adapt through different problems
This led to; defining the problem in two folds:
User’s Lens:
How might we make feedback more personal and connected to real product experiences — so users feel genuinely heard rather than fatigued by repetitive, disjointed surveys?
User’s Lens:
How might we make feedback more personal and connected to real product experiences — so users feel genuinely heard rather than fatigued by repetitive, disjointed surveys?
Who needs Help?
During discovery, our goal was to understand what teams across Safaricom needed from a survey and feedback system. Through stakeholder workshops and interviews, we identified key user requirements that guided Dubi’s design direction:
Reguirements and Persona
Product Managers, Researchers & Marketing Teams
Requirement
A unified, easy-to-use platform to launch, track, and analyze targeted surveys
Insight
Teams needed a single source of truth for feedback collection, segmentation, and measuring feature or campaign success without relying on multiple external tools.
Developers, Executives & Analysts
Requirement
Seamless integration and real-time analytics dashboards
Insight
An effortless survey triggers within journeys and instant access to engagement, NPS, and performance data to make faster, data-driven decisions.
Competitive analysis
I conducted a competitive analysis to identify commonalities among competitors and gather valuable insights for building our product. This allowed me to differentiate ourselves and provided a basis for product development.
User flows
I created a visual user flow to align with the feature functionality before designing the interface. This also contributes to a smoother navigation experience, helping users accomplish tasks efficiently.
Feature Prioritization
We sorted out ideas through an Eisenhower Matrix. (also called the Urgent-Important Matrix) is a prioritization framework that helps teams and individuals decide what to focus on first — based on urgency and importance.
Let's get to work
The MVP
With all the necessary foundations, knowledge, and preparation in place, I began to design the interface for dubi. We prioritized the creation of surveys through templates with ready questions since it was faster to implement. The design aimed to add make the whole process of creating, sharing and gathering responses a simple and straight forward without compromising efficiency and prioritize user-centricity.
Landing Page
A centralized hub for managing all ideaboards. Including a quick board creation and user engaugement.
A summary dashboard where users can view summaries, track responses and detailed analytics.
A user-friendly interface with drag-and-drop functionality and pre-build questions.
Pre-made templates with pre-set questions that match each type of survey.
Blank Template
Create questions from scratch
Add and setup contents easily
Customer Satisfaction Score
Gauge customer happiness
Get overall satisfaction of a product
Feedback Form
Measure the loyalty of customers
Survey Creation
A simple and straight forward way users can build effective surveys and get valuable insights.
A tool for designing surveys with various question types.
Survey Distribution: Option to share survey via email and as a short code.
Data analysis: A tool to analyse and visualise survey data
Audience Creation
Touch Point (channel)
A touch point (channel) is any interaction or point of contact between a user and a product, service, or brand. We created an idea board to map out all potential touch points, such as website visits, mobile app notifications, customer support calls, social media interactions, and in-store experiences.
Idea Board
A simple Internal Ideaboard for collecting and organize internal thoughts track problems, insights, or options during a project or team retros.
Analytic Dashboard
A center hub for managing all surveys, including a quick survey creations, Idea board and performance metrics
Business Value
Impact (First 3 Months)
After the General Availability launch of 2FA, we utilized Microsoft Clarity and Metabase data to track and address any usability issues, ensuring the achievement of our business goal.
Total Surveys Created
604
Journey NPS
97
Simple Surveys
507
JNPS Survey Engagements:
92+ million
High-volume engagement from automated journey surveys (JNPS).
Audience Engagement
4.8 million
Represents the total number of user responses/conversations from manual/audience surveys.
Total Audiences Uploaded
51+ million
Indicates the wide reach and potential exposure of Dubi surveys.
Testimonials
Users Reviews
"Automated surveys saved our teams hours, produced reliable signals, and helped us track shifts across journeys with ease"
Segment Lead
Safaricom, Ethiopia
10 Sep, 2024
"Audience uploads feel smooth even with huge lists. Pre and post campaign surveys help me catch drop-offs early, but I need stronger segmentation."
Segment Lead
Safaricom, Kenya
13 Nov, 2024
Next Steps
Looking ahead, we also continued to think about ways to improve the user experience, such as 🤖Adding AI-powered insights agent, ideas board enhancements, and cross-team governance templates to sustain and scale user engagement.
🧭Feedback Triage System -A centralized dashboard will help teams triage incoming feedback, assign ownership, track resolution status, and ensure that valuable customer input is acted on efficiently.
📈Elegant Multi-Metric Display - Enhanced NPS and CSAT trend charts with gradient fills and smooth animations Vibrant Emotional Ratings - Interactive pie chart with delighted, neutral, and frustrated sentiment indicators.
💬Emotional Rating Visualization - An interactive sentiment pie chart will showcase delighted, neutral, and frustrated responses, giving a quick, emotional snapshot of the customer experience at a glance.
Lessons Learned
After the launch, I realized several key lessons. Reflecting on the process from planning to execution revealed insights about the importance of adaptability and open-mindedness. These reflections deepened my understanding and offered valuable lessons for future launches and products.
I learned that simplicity and automation drive adoption.
A cross-functional effort between UX, engineering, and marketing teams. Led the product design vision from discovery to rollout — driving clarity, speed, and measurable impact.A cross-functional effort between UX, engineering, and marketing teams. Led the product design vision from discovery to rollout — driving clarity, speed, and measurable impact.
The team behind
Meet our team
Clinton Wekesa
Action Product Owner
Stephen Maina
Tech Lead Software Engineering
Christopher Muiruri
Frontend Web Developer
Francis Gituku
Research and Planning.
Alex Karanja
Ux Lead
Moses Mutua
Bunisness Analyst
Gloria Mutie
Backend Developer
Nehemiah Cheburet
Solution Architect
View More
View More
Other Projects
View More
Other Projects
Design System
Enabling 100+ designers & developers to ship cohesive experiences faster
Read More
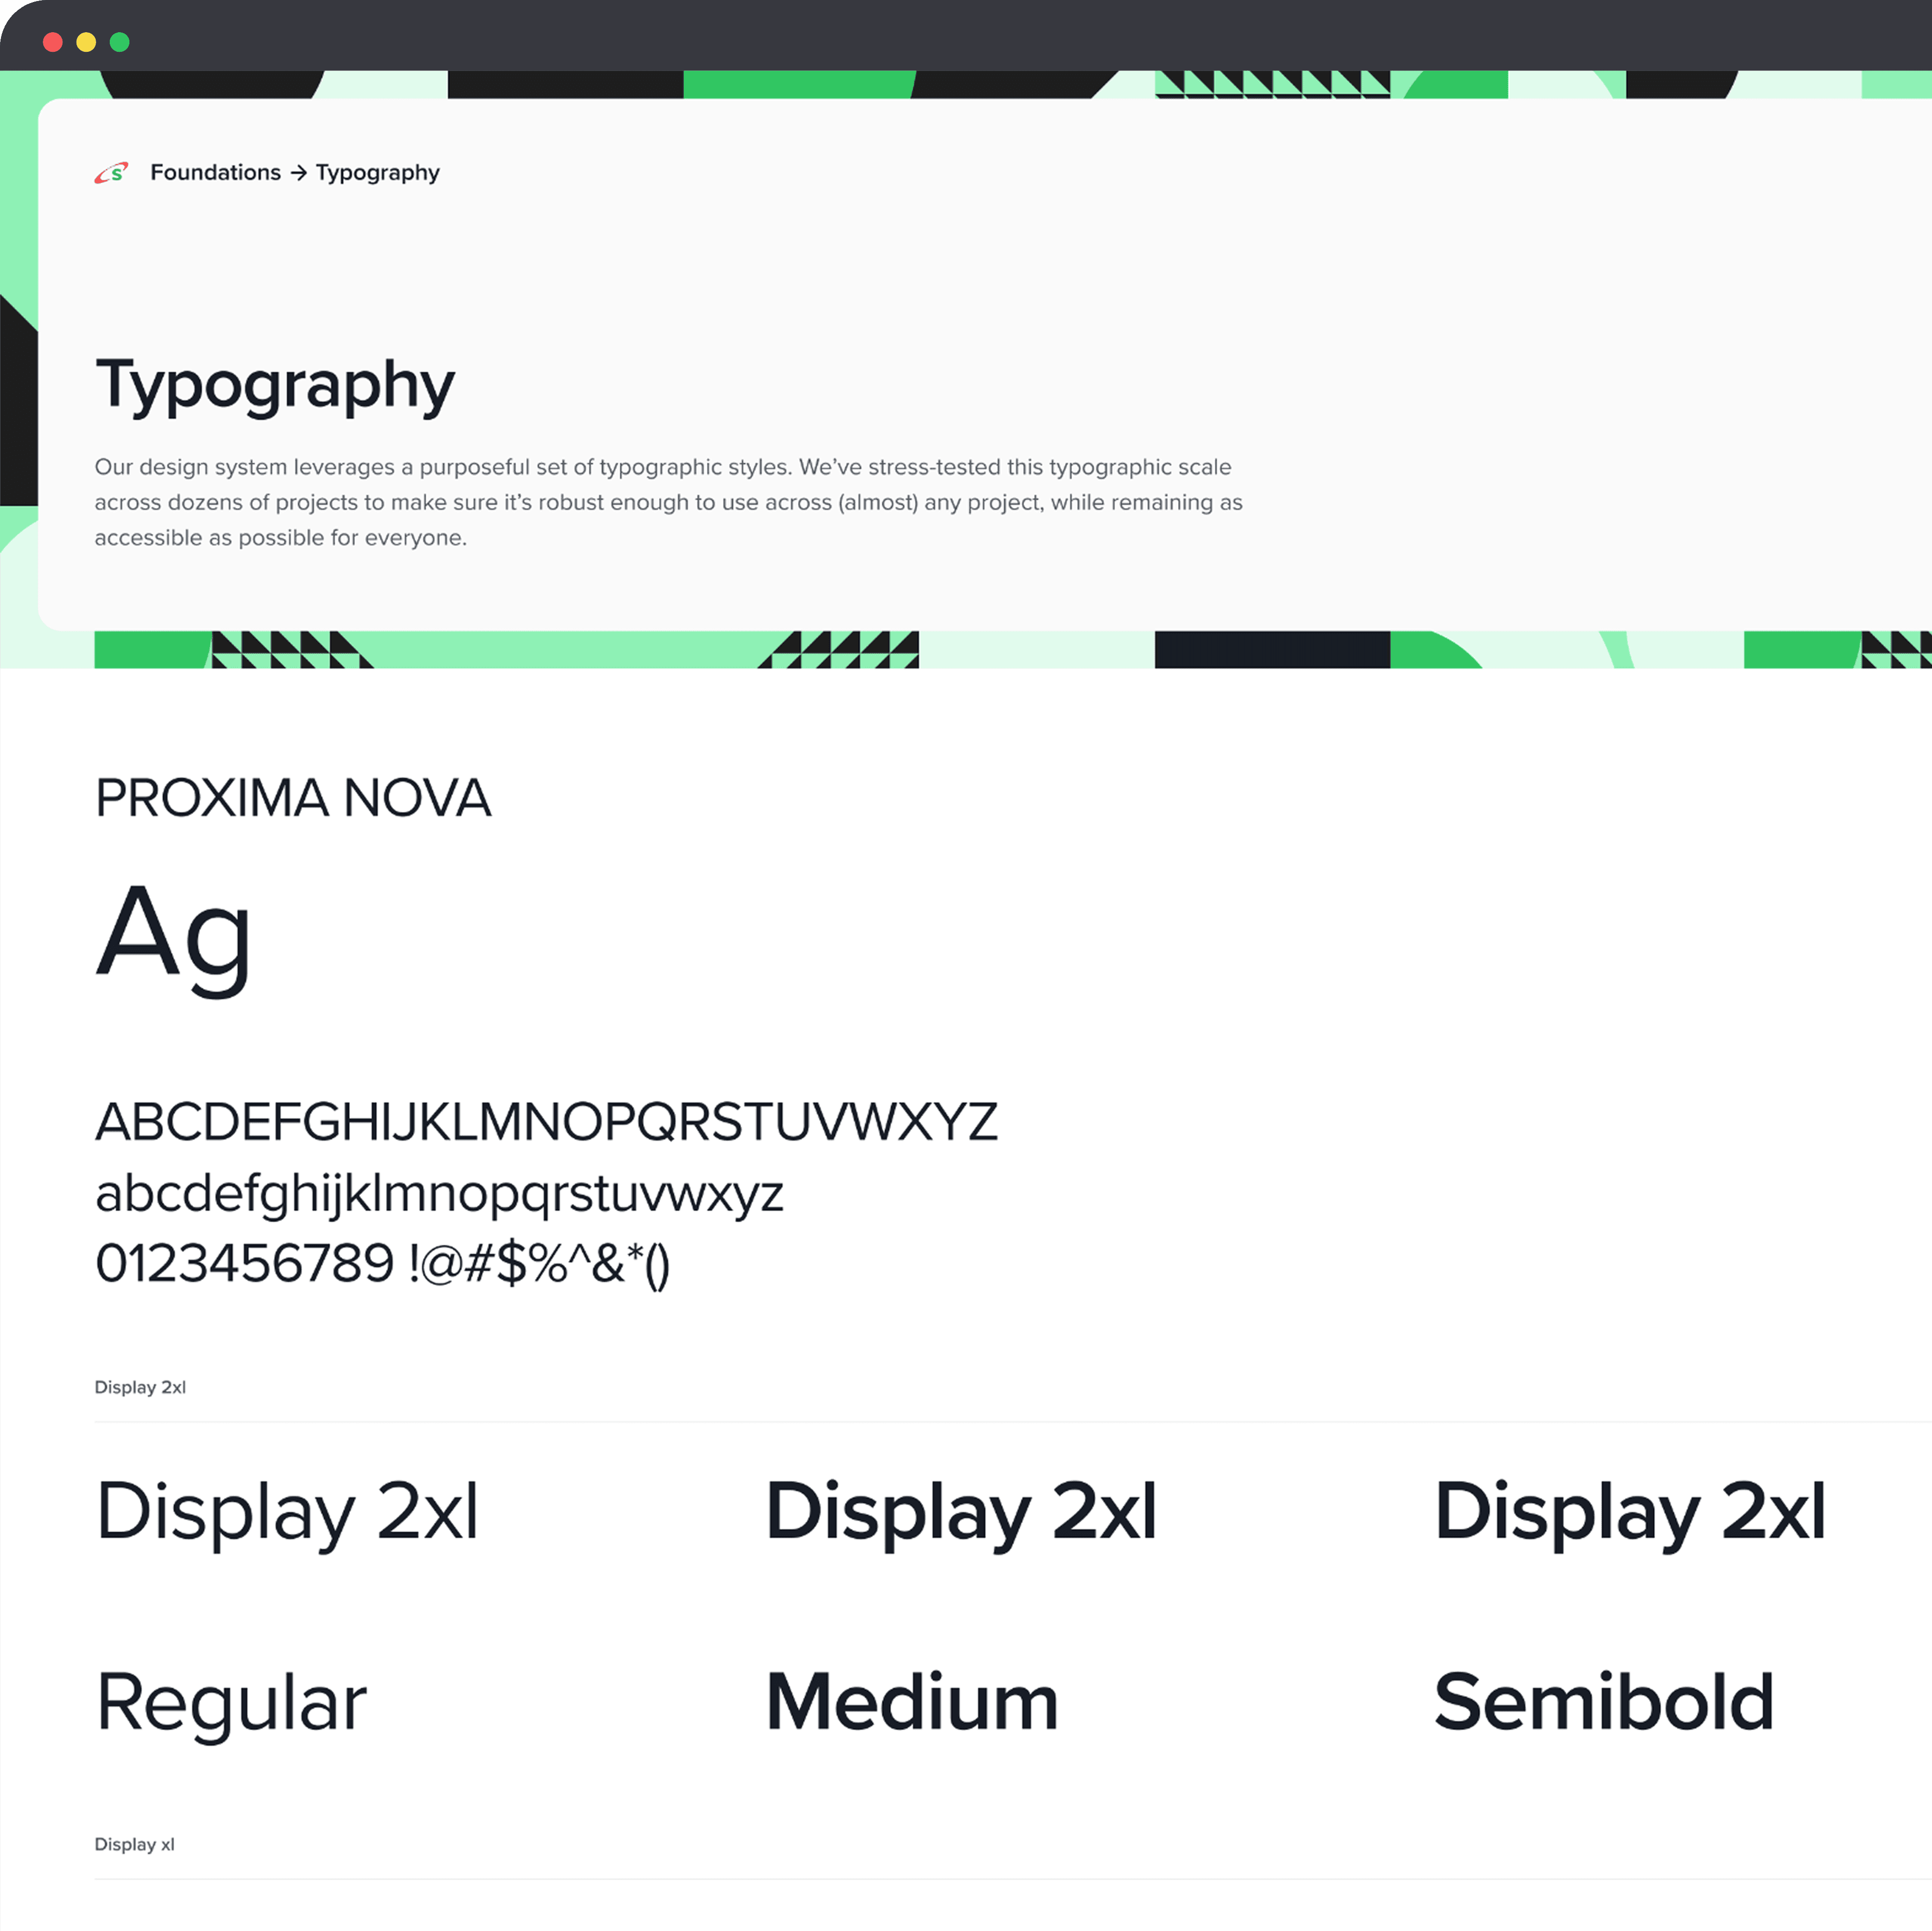
Design System
Enabling 100+ designers & developers to ship cohesive experiences faster
Read More
Design System
Enabling 100+ designers & developers to ship cohesive experiences faster
Read More
Partner App Redesign
Driving Growth: A Redesign to Increase Agent Productivity and improve user expereince
Casestudy Coming Soon

Partner App Redesign
Driving Growth: A Redesign to Increase Agent Productivity and improve user expereince
Casestudy Coming Soon
Partner App Redesign
Driving Growth: A Redesign to Increase Agent Productivity and improve user expereince
Casestudy Coming Soon
Apps Merging
Consolidating Chaos into One single Seamless Experience on One App.
Casestudy Coming Soon

Apps Merging
Consolidating Chaos into One single Seamless Experience on One App.
Casestudy Coming Soon
Apps Merging
Consolidating Chaos into One single Seamless Experience on One App.
Casestudy Coming Soon